Walkthrough 1
The below are a few examples of possible School reports:
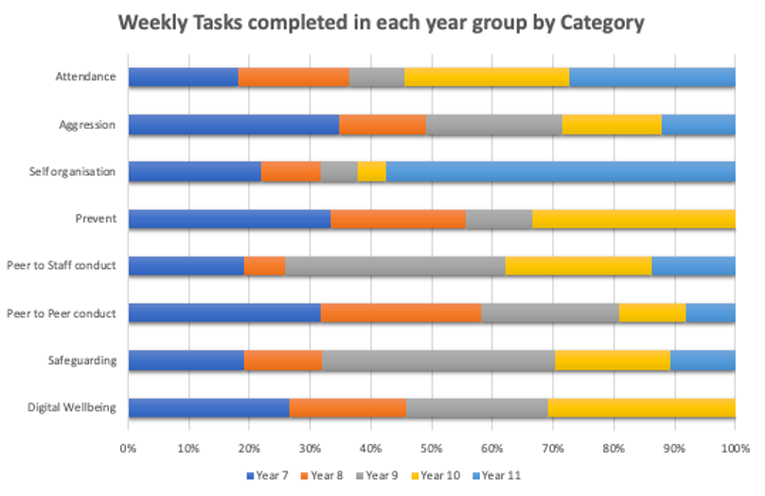
- Tasks set by category
- Concerns raised by category
- Increasing concerns - by group - watchlist
Here is a snapshot but the capabilities and granular data are significant.
(Click to dismiss)Walkthrough 2
A basic example of the capability / range:
- For school report: Number of incidents logged over time (week by week)
- Percentages to show trends in each of the categories (e.g. bullying, safeguarding, SEND diagnostics, attendance, exclusions)
- Types of behaviours reported, by category
- Types of concerns highlighted, by category
- Current mood status (filter by school, year group, group type)
- School: Proportions of year groups completing tasks this week/term, split by category Group: Single bar
- Group watchlists, by number of incidents. For a group, this would list individuals.
Here is a snapshot but the capabilities and granular data are significant.
(Click to dismiss)REPORTS
School - Overview
Reports for the Senior Management Team
Report Builder
[ Select, Explore, Build and View Reports ]
Overall School - Pie Charts
Pupil Weekly Task Assignments
Bar Report By: 1 Week (Week Ending 31/05/2022)
Logged Incidents: Preventative Class / Year Group
Year Groups Selected: 7, 8, 9, 10, 11
Topics: 8
Total Sessions / Users: 724
| Category | Year 7 | Year 8 | Year 9 | Year 10 | Year 11 | Total | ||||||||||||||
| Digital Wellbeing | 76 | 55 | 67 | 88 | 0 | 286 | ||||||||||||||
| Safeguarding | 9 | 6 | 18 | 9 | 5 | 47 | ||||||||||||||
| Peer to Peer Conduct | 35 | 29 | 25 | 12 | 9 | 110 | ||||||||||||||
| Peer to Staff Conduct | 11 | 4 | 21 | 14 | 8 | 58 | ||||||||||||||
| Prevent | 3 | 2 | 1 | 3 | 0 | 9 | ||||||||||||||
| Self-organisation | 29 | 13 | 8 | 6 | 76 | 132 | ||||||||||||||
| Aggression | 17 | 7 | 11 | 8 | 6 | 49 | ||||||||||||||
| Attendance | 6 | 6 | 3 | 9 | 9 | 33 | ||||||||||||||
| Total | 186 | 122 | 154 | 149 | 113 | 724 |
Pupil Monthly Logged Incidents
Month: October 2021
Criteria: Logged Incidents
Year Groups Selected: 7, 8, 9, 10, 11
| Week Ending | Number of incidents (all) | Year 8 | Year 9 | Year 10 | Year 11 | Total | ||||||||||||||
| 02/10/2022 | 42 | 10 | 4 | 16 | 12 | 10 | ||||||||||||||
| 09/10/2022 | 46 | 9 | 6 | 22 | 9 | 9 | ||||||||||||||
| 16/10/2022 | 50 | 9 | 6 | 25 | 12 | 9 | ||||||||||||||
| 23/10/2022 | 43 | 8 | 4 | 21 | 10 | 7 |